|
The Gantt Chart
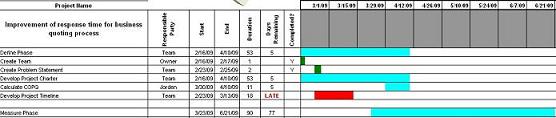
The Gantt Chart is a simple project management tool. It is used to track the timeline of tasks or events that make up your project. A screenshot of our Gantt Chart appears below. As you can see from the photo, this tool shows an overview of your project, and provides the same information graphically with horizontal bars (much like a bar chart or pareto chart). Six Sigma Black and Green Belts commonly use this type of chart as a means to ensure that their improvement projects remain on schedule. So what we've done is to create an effective means of utilizing a Gantt Chart without having to go to the expense of buying that expensive project management software (as much as $799 for the well known brand). And we'll tell you up front that our spreadsheet does not contain all the bells and whistles of the expensive software, and it does not automatically integrate into commonly used business software (this isn't expensive software, so something had to give). The Gantt Chart is an outstanding organizational tool. I've been advising my ISO9001 clients for many years to do more planning. Not only from an overall business perspective, but from a quality system viewpoint as well. Those of you who are well versed in quality management systems already understand the requirements for planning within a quality system, and this tool fits in well (it can also be audit evidence for any continual improvement opportunities!). Any time a change is made, the change almost always has an effect upon something else... documents, people, processes, and so forth. These are the concepts you must consider when making any change within your company. I tell my clients and students, "There's no substitute for a good plan." As part of your plan, you'll want to detail the steps or tasks required to complete the change. You'll also want to know who is responsible for the completion of each task, and when it will be completed. Some tasks can't be started before other tasks are completed. And in many Six Sigma projects, there might be as many as 40 or more individual tasks before the project can be evaluated! Can you imagine trying to manage 40 tasks to completion without some tracking device? That would be a recipe for failure! How it Works 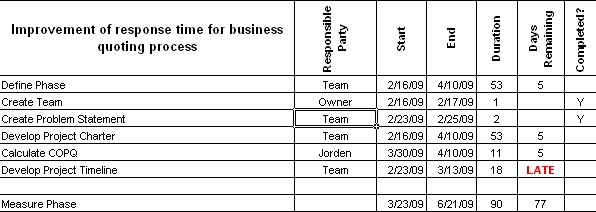 The image above shows where your information is entered. List your tasks in the first column, select the start date and end date for the tasks. The example text shows the beginning of a Six Sigma project for improving the time to complete a quote request. Some common terminology was entered as the tasks to be completed with both start and end dates. 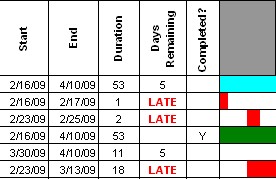 The screenshot to the left depicts what happens on the spreadsheet once your task data is entered. Task duration is automatically calculated (in calendar days), as well as the number of days remaining until the targeted completion date. We even let you know when the task is considered "LATE." The screenshot to the left depicts what happens on the spreadsheet once your task data is entered. Task duration is automatically calculated (in calendar days), as well as the number of days remaining until the targeted completion date. We even let you know when the task is considered "LATE." Current tasks are shown with the blue bars in the graph section of the Gantt Chart, late tasks shown as a red bar, and completed tasks have a green bar. Plus, there's none of those silly macros running in the background of this spreadsheet... no chance of something potentially malicious going on in the background. Sometimes macros are necessary to provide the result needed... but we won't create a spreadsheet with one unless we absolutely must. Safety first! Heard enough? Buy our Gantt Chart now... only $3.95
|
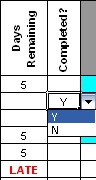 As soon as each individual task is completed, simply go to the completed column and choose "Y" to indicate completion. If you desire, you can select "N" for any or all not completed tasks without any concerns... or you can simply leave the column blank until the task is completed. We errorproofed this element so that other team members cannot accidentally enter other data in the column. We also errorproofed the start date column... the start dates are compared to the start date of your first task. All additional task start dates must be equal to or greater than the initial start date.

